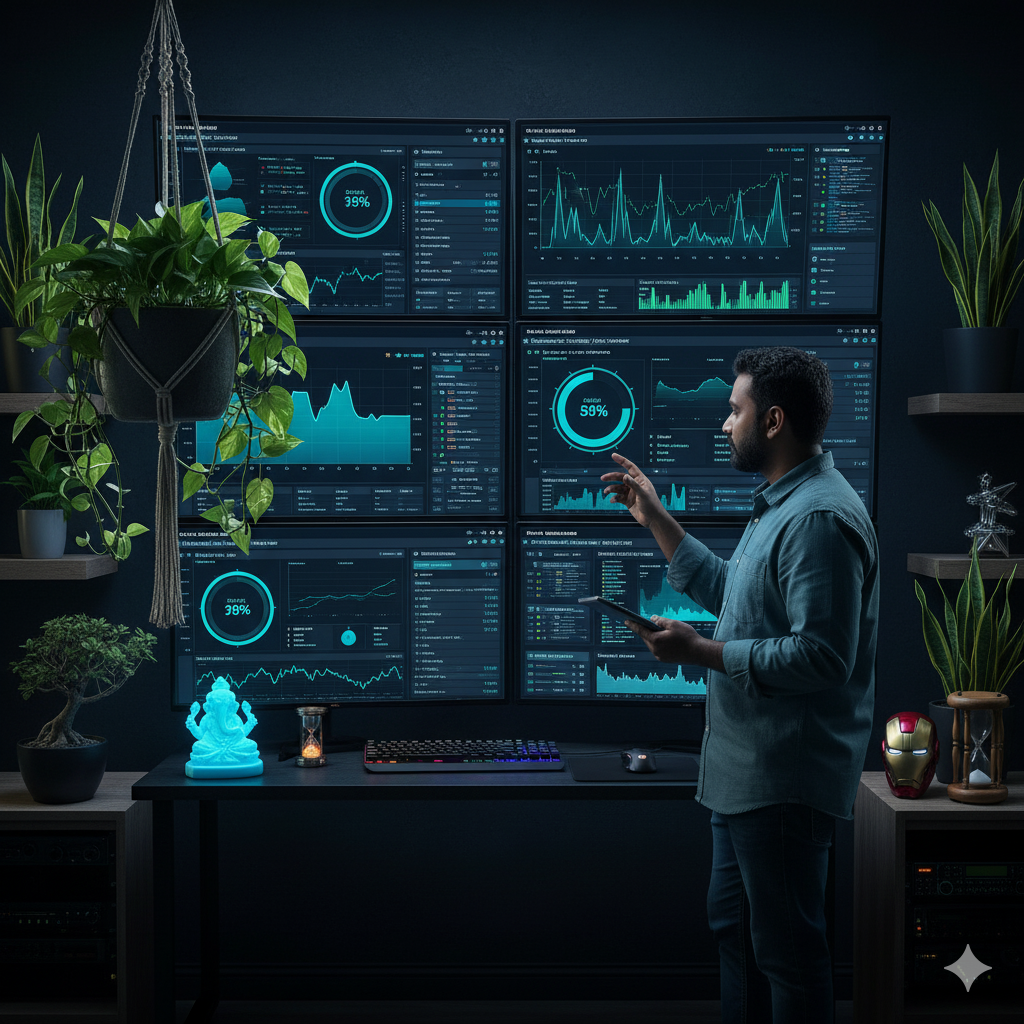
Observability & Monitoring Stack
Gain complete visibility into your systems with a unified observability stack. We set up monitoring, logging, and alerting pipelines that help your team detect, diagnose, and resolve issues before they impact users.
Solution at a Glance
4
Key Features
10+
Successful Implementations
Our Proven Methodology
A step-by-step look into how we deliver excellence.
See Everything That Matters
Modern applications are distributed and dynamic making observability essential. Our Observability & Monitoring Stack gives your team real-time insights into application performance, infrastructure health, and user experience. Using tools like Prometheus, Grafana, Loki, and OpenTelemetry, we create end-to-end visibility across all layers of your system.
01
Unified Metrics, Logs, and Traces
We combine logs, metrics, and distributed traces into a single, cohesive platform. Instead of switching between tools, your team can analyze system behavior holistically identifying performance bottlenecks, debugging complex flows, and understanding user-impacting issues within seconds. Our setups work across containers, microservices, and serverless environments alike.
02
Proactive Alerting & Incident Response
We integrate smart alerting rules and notification channels to help teams act before problems escalate. Alerts are routed to Slack, Teams, or PagerDuty based on severity. Combined with uptime probes and anomaly detection, your monitoring system evolves from reactive to proactive, preventing outages before they impact customers.
03
Data That Drives Decisions
Observability isn’t just about monitoring. It’s about empowerment. We visualize KPIs such as latency, request volume, infrastructure cost, and deployment impact to help technical and business teams make data-driven decisions. With observability in place, you gain the confidence to innovate faster, knowing your systems are measurable and dependable.
04
Explore the Features
Click on a feature to see it in action.
Unified Observability Stack
Combine metrics, logs, and traces into one platform using Prometheus, Grafana, Loki, and OpenTelemetry for full visibility.
